You can make your plots more accessible by adding alt-text via the code block option #| fig-alt:
Author
Affiliation
Erwin Lares
Research Cyberinfrastructure (RCI), Division of Information Technology, UW-Madison
Published
June 22, 2026
Modified
July 17, 2026
1 A small step to make content more accessible
UW–Madison digital accessibility policy states that “UW-Madison shall provide digital resources and information technology that are accessible to all, to the fullest extent technically feasible given an assessment of available resources, and subject to the Digital Accessibility Standards.”
Considering that the research artifacts researchers create and publish on the Data Science Platform end in .wisc.edu, we believe that they are subject to this policy and must be made accessible.
This post is the first of many to help researchers adopt with these accessibility requirements the easiest way possible. Today’s post covers adding alt-text to one’s ggplot2 generated plots and charts. Alt-text is a written description of an image that is read aloud by screen readers for people with visual impairments or those using assistive technologies. It also helps search engines understand the content of an image.
2 A toy example
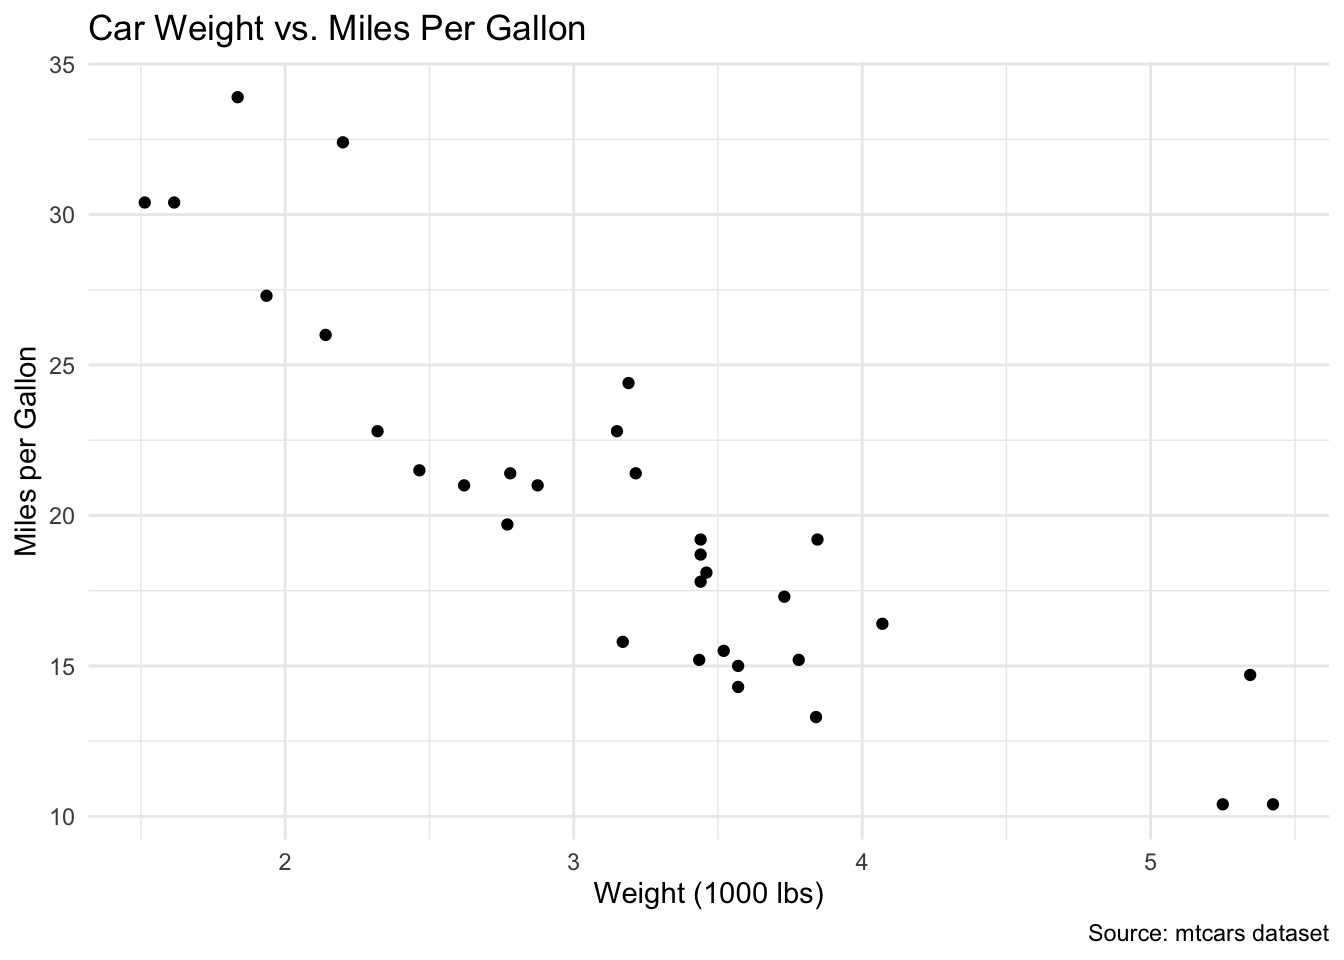
The block of code below creates a plot using the dataset mtcars included with R. It plots the weight of the vehicles per 1000 pounds against the vehicle efficiency in miles per gallon. The resulting plots show that as the weight of the vehicle increases, the fuel efficiency decreases.
library(ggplot2)# Sample ggplot2 plotggplot(mtcars, aes(x = wt, y = mpg)) +geom_point() +labs(title ="Car Weight vs. Miles Per Gallon",x ="Weight (1000 lbs)",y ="Miles per Gallon",alt ="A scatter plot showing vehicle fuel efficiency against vehicle weight",caption ="Source: mtcars dataset") +theme_minimal()
Plot with no alt-text property
3 ggplot2 limitations and an html work-around
The very first thing one can do to make plots more accessible and easier to interpret is to clearly and succintly label all relevant parts of the plot. Minimally, these include providing a plot title and labeling the axes accordingly.
The labs() function from the ggplot2() package includes arguments such as title, subtitle, caption, x, and y that can help accomplish this minimal labeling to meet accessibility requirements
The labs() function also includes an alt argument. Unfortunately, at this time passing the alt-text as a value to the alt argument does not result in alt-text being available to screen readers. I am planning to submit an issue to the ggplot GitHub repo.
When this document is rendered to an html document the plot doesn’t result in a properly tagged plot with the intended alt-text attribute. Right-clicking on any element alows to inspect it. Doing so shows that the alt-text attribute is machine-generated alt-text and not accessible.
Fortunately, there is an easy to implement solution. Next time a plot is needed, add the fig-alt: chunk option followed by the alt-text itself.
Plot with alt-text property
TipWhere to place the code chunk options
Quarto gives the choice of placing chunk options as key:value pairs outside the curly brackets that identify the type of code chunk. Start with a #|, followed by the chunk option, a colon, and then the value.
With the fig-alt chunk option in place. The rendered plot bears the alt-text that makes the plot accessible. If we inspect the second plot, we see that the html element displaying the plot does, indeed, bear the appropriate alt-text attribute specified by the fig-alt chunk option.